Hull MA + ADX (Manual) Trend FilterA basic Hull MA with adx imbedded that highlights green or red based on trend direction. The highlight doesn't initiate until the adx is above 20.
Moving Averages

SuperTrend Touch SignalsAlwin's Magic
"Bro I’ve cooked up a trading magic using Supertrend 😎
It literally tells me when to buy and when to sell — like green means go, red means run! Been testing it and damn, it's 🔥🔥🔥
Need to make it automatic next!"

VoVix DEVMA🌌 VoVix DEVMA: A Deep Dive into Second-Order Volatility Dynamics
Welcome to VoVix+, a sophisticated trading framework that transcends traditional price analysis. This is not merely another indicator; it is a complete system designed to dissect and interpret the very fabric of market volatility. VoVix+ operates on the principle that the most powerful signals are not found in price alone, but in the behavior of volatility itself. It analyzes the rate of change, the momentum, and the structure of market volatility to identify periods of expansion and contraction, providing a unique edge in anticipating major market moves.
This document will serve as your comprehensive guide, breaking down every mathematical component, every user input, and every visual element to empower you with a profound understanding of how to harness its capabilities.
🔬 THEORETICAL FOUNDATION: THE MATHEMATICS OF MARKET DYNAMICS
VoVix+ is built upon a multi-layered mathematical engine designed to measure what we call "second-order volatility." While standard indicators analyze price, and first-order volatility indicators (like ATR) analyze the range of price, VoVix+ analyzes the dynamics of the volatility itself. This provides insight into the market's underlying state of stability or chaos.
1. The VoVix Score: Measuring Volatility Thrust
The core of the system begins with the VoVix Score. This is a normalized measure of volatility acceleration or deceleration.
Mathematical Formula:
VoVix Score = (ATR(fast) - ATR(slow)) / (StDev(ATR(fast)) + ε)
Where:
ATR(fast) is the Average True Range over a short period, representing current, immediate volatility.
ATR(slow) is the Average True Range over a longer period, representing the baseline or established volatility.
StDev(ATR(fast)) is the Standard Deviation of the fast ATR, which measures the "noisiness" or consistency of recent volatility.
ε (epsilon) is a very small number to prevent division by zero.
Market Implementation:
Positive Score (Expansion): When the fast ATR is significantly higher than the slow ATR, it indicates a rapid increase in volatility. The market is "stretching" or expanding.
Negative Score (Contraction): When the fast ATR falls below the slow ATR, it indicates a decrease in volatility. The market is "coiling" or contracting.
Normalization: By dividing by the standard deviation, we normalize the score. This turns it into a standardized measure, allowing us to compare volatility thrust across different market conditions and timeframes. A score of 2.0 in a quiet market means the same, relatively, as a score of 2.0 in a volatile market.
2. Deviation Analysis (DEV): Gauging Volatility's Own Volatility
The script then takes the analysis a step further. It calculates the standard deviation of the VoVix Score itself.
Mathematical Formula:
DEV = StDev(VoVix Score, lookback_period)
Market Implementation:
This DEV value represents the magnitude of chaos or stability in the market's volatility dynamics. A high DEV value means the volatility thrust is erratic and unpredictable. A low DEV value suggests the change in volatility is smooth and directional.
3. The DEVMA Crossover: Identifying Regime Shifts
This is the primary signal generator. We take two moving averages of the DEV value.
Mathematical Formula:
fastDEVMA = SMA(DEV, fast_period)
slowDEVMA = SMA(DEV, slow_period)
The Core Signal:
The strategy triggers on the crossover and crossunder of these two DEVMA lines. This is a profound concept: we are not looking at a moving average of price or even of volatility, but a moving average of the standard deviation of the normalized rate of change of volatility.
Bullish Crossover (fastDEVMA > slowDEVMA): This signals that the short-term measure of volatility's chaos is increasing relative to the long-term measure. This often precedes a significant market expansion and is interpreted as a bullish volatility regime.
Bearish Crossunder (fastDEVMA < slowDEVMA): This signals that the short-term measure of volatility's chaos is decreasing. The market is settling down or contracting, often leading to trending moves or range consolidation.
⚙️ INPUTS MENU: CONFIGURING YOUR ANALYSIS ENGINE
Every input has been meticulously designed to give you full control over the strategy's behavior. Understanding these settings is key to adapting VoVix+ to your specific instrument, timeframe, and trading style.
🌀 VoVix DEVMA Configuration
🧬 Deviation Lookback: This sets the lookback period for calculating the DEV value. It defines the window for measuring the stability of the VoVix Score. A shorter value makes the system highly reactive to recent changes in volatility's character, ideal for scalping. A longer value provides a smoother, more stable reading, better for identifying major, long-term regime shifts.
⚡ Fast VoVix Length: This is the lookback period for the fastDEVMA. It represents the short-term trend of volatility's chaos. A smaller number will result in a faster, more sensitive signal line that reacts quickly to market shifts.
🐌 Slow VoVix Length: This is the lookback period for the slowDEVMA. It represents the long-term, baseline trend of volatility's chaos. A larger number creates a more stable, slower-moving anchor against which the fast line is compared.
How to Optimize: The relationship between the Fast and Slow lengths is crucial. A wider gap (e.g., 20 and 60) will result in fewer, but potentially more significant, signals. A narrower gap (e.g., 25 and 40) will generate more frequent signals, suitable for more active trading styles.
🧠 Adaptive Intelligence
🧠 Enable Adaptive Features: When enabled, this activates the strategy's performance tracking module. The script will analyze the outcome of its last 50 trades to calculate a dynamic win rate.
⏰ Adaptive Time-Based Exit: If Enable Adaptive Features is on, this allows the strategy to adjust its Maximum Bars in Trade setting based on performance. It learns from the average duration of winning trades. If winning trades tend to be short, it may shorten the time exit to lock in profits. If winners tend to run, it will extend the time exit, allowing trades more room to develop. This helps prevent the strategy from cutting winning trades short or holding losing trades for too long.
⚡ Intelligent Execution
📊 Trade Quantity: A straightforward input that defines the number of contracts or shares for each trade. This is a fixed value for consistent position sizing.
🛡️ Smart Stop Loss: Enables the dynamic stop-loss mechanism.
🎯 Stop Loss ATR Multiplier: Determines the distance of the stop loss from the entry price, calculated as a multiple of the current 14-period ATR. A higher multiplier gives the trade more room to breathe but increases risk per trade. A lower multiplier creates a tighter stop, reducing risk but increasing the chance of being stopped out by normal market noise.
💰 Take Profit ATR Multiplier: Sets the take profit target, also as a multiple of the ATR. A common practice is to set this higher than the Stop Loss multiplier (e.g., a 2:1 or 3:1 reward-to-risk ratio).
🏃 Use Trailing Stop: This is a powerful feature for trend-following. When enabled, instead of a fixed stop loss, the stop will trail behind the price as the trade moves into profit, helping to lock in gains while letting winners run.
🎯 Trail Points & 📏 Trail Offset ATR Multipliers: These control the trailing stop's behavior. Trail Points defines how much profit is needed before the trail activates. Trail Offset defines how far the stop will trail behind the current price. Both are based on ATR, making them fully adaptive to market volatility.
⏰ Maximum Bars in Trade: This is a time-based stop. It forces an exit if a trade has been open for a specified number of bars, preventing positions from being held indefinitely in stagnant markets.
⏰ Session Management
These inputs allow you to confine the strategy's trading activity to specific market hours, which is crucial for day trading instruments that have defined high-volume sessions (e.g., stock market open).
🎨 Visual Effects & Dashboard
These toggles give you complete control over the on-chart visuals and the dashboard. You can disable any element to declutter your chart or focus only on the information that matters most to you.
📊 THE DASHBOARD: YOUR AT-A-GLANCE COMMAND CENTER
The dashboard centralizes all critical information into one compact, easy-to-read panel. It provides a real-time summary of the market state and strategy performance.
🎯 VOVIX ANALYSIS
Fast & Slow: Displays the current numerical values of the fastDEVMA and slowDEVMA. The color indicates their direction: green for rising, red for falling. This lets you see the underlying momentum of each line.
Regime: This is your most important environmental cue. It tells you the market's current state based on the DEVMA relationship. 🚀 EXPANSION (Green) signifies a bullish volatility regime where explosive moves are more likely. ⚛️ CONTRACTION (Purple) signifies a bearish volatility regime, where the market may be consolidating or entering a smoother trend.
Quality: Measures the strength of the last signal based on the magnitude of the DEVMA difference. An ELITE or STRONG signal indicates a high-conviction setup where the crossover had significant force.
PERFORMANCE
Win Rate & Trades: Displays the historical win rate of the strategy from the backtest, along with the total number of closed trades. This provides immediate feedback on the strategy's historical effectiveness on the current chart.
EXECUTION
Trade Qty: Shows your configured position size per trade.
Session: Indicates whether trading is currently OPEN (allowed) or CLOSED based on your session management settings.
POSITION
Position & PnL: Displays your current position (LONG, SHORT, or FLAT) and the real-time Profit or Loss of the open trade.
🧠 ADAPTIVE STATUS
Stop/Profit Mult: In this simplified version, these are placeholders. The primary adaptive feature currently modifies the time-based exit, which is reflected in how long trades are held on the chart.
🎨 THE VISUAL UNIVERSE: DECIPHERING MARKET GEOMETRY
The visuals are not mere decorations; they are geometric representations of the underlying mathematical concepts, designed to give you an intuitive feel for the market's state.
The Core Lines:
FastDEVMA (Green/Maroon Line): The primary signal line. Green when rising, indicating an increase in short-term volatility chaos. Maroon when falling.
SlowDEVMA (Aqua/Orange Line): The baseline. Aqua when rising, indicating a long-term increase in volatility chaos. Orange when falling.
🌊 Morphism Flow (Flowing Lines with Circles):
What it represents: This visualizes the momentum and strength of the fastDEVMA. The width and intensity of the "beam" are proportional to the signal strength.
Interpretation: A thick, steep, and vibrant flow indicates powerful, committed momentum in the current volatility regime. The floating '●' particles represent kinetic energy; more particles suggest stronger underlying force.
📐 Homotopy Paths (Layered Transparent Boxes):
What it represents: These layered boxes are centered between the two DEVMA lines. Their height is determined by the DEV value.
Interpretation: This visualizes the overall "volatility of volatility." Wider boxes indicate a chaotic, unpredictable market. Narrower boxes suggest a more stable, predictable environment.
🧠 Consciousness Field (The Grid):
What it represents: This grid provides a historical lookback at the DEV range.
Interpretation: It maps the recent "consciousness" or character of the market's volatility. A consistently wide grid suggests a prolonged period of chaos, while a narrowing grid can signal a transition to a more stable state.
📏 Functorial Levels (Projected Horizontal Lines):
What it represents: These lines extend from the current fastDEVMA and slowDEVMA values into the future.
Interpretation: Think of these as dynamic support and resistance levels for the volatility structure itself. A crossover becomes more significant if it breaks cleanly through a prior established level.
🌊 Flow Boxes (Spaced Out Boxes):
What it represents: These are compact visual footprints of the current regime, colored green for Expansion and red for Contraction.
Interpretation: They provide a quick, at-a-glance confirmation of the dominant volatility flow, reinforcing the background color.
Background Color:
This provides an immediate, unmistakable indication of the current volatility regime. Light Green for Expansion and Light Aqua/Blue for Contraction, allowing you to assess the market environment in a split second.
📊 BACKTESTING PERFORMANCE REVIEW & ANALYSIS
The following is a factual, transparent review of a backtest conducted using the strategy's default settings on a specific instrument and timeframe. This information is presented for educational purposes to demonstrate how the strategy's mechanics performed over a historical period. It is crucial to understand that these results are historical, apply only to the specific conditions of this test, and are not a guarantee or promise of future performance. Market conditions are dynamic and constantly change.
Test Parameters & Conditions
To ensure the backtest reflects a degree of real-world conditions, the following parameters were used. The goal is to provide a transparent baseline, not an over-optimized or unrealistic scenario.
Instrument: CME E-mini Nasdaq 100 Futures (NQ1!)
Timeframe: 5-Minute Chart
Backtesting Range: March 24, 2024, to July 09, 2024
Initial Capital: $100,000
Commission: $0.62 per contract (A realistic cost for futures trading).
Slippage: 3 ticks per trade (A conservative setting to account for potential price discrepancies between order placement and execution).
Trade Size: 1 contract per trade.
Performance Overview (Historical Data)
The test period generated 465 total trades , providing a statistically significant sample size for analysis, which is well above the recommended minimum of 100 trades for a strategy evaluation.
Profit Factor: The historical Profit Factor was 2.663 . This metric represents the gross profit divided by the gross loss. In this test, it indicates that for every dollar lost, $2.663 was gained.
Percent Profitable: Across all 465 trades, the strategy had a historical win rate of 84.09% . While a high figure, this is a historical artifact of this specific data set and settings, and should not be the sole basis for future expectations.
Risk & Trade Characteristics
Beyond the headline numbers, the following metrics provide deeper insight into the strategy's historical behavior.
Sortino Ratio (Downside Risk): The Sortino Ratio was 6.828 . Unlike the Sharpe Ratio, this metric only measures the volatility of negative returns. A higher value, such as this one, suggests that during this test period, the strategy was highly efficient at managing downside volatility and large losing trades relative to the profits it generated.
Average Trade Duration: A critical characteristic to understand is the strategy's holding period. With an average of only 2 bars per trade , this configuration operates as a very short-term, or scalping-style, system. Winning trades averaged 2 bars, while losing trades averaged 4 bars. This indicates the strategy's logic is designed to capture quick, high-probability moves and exit rapidly, either at a profit target or a stop loss.
Conclusion and Final Disclaimer
This backtest demonstrates one specific application of the VoVix+ framework. It highlights the strategy's behavior as a short-term system that, in this historical test on NQ1!, exhibited a high win rate and effective management of downside risk. Users are strongly encouraged to conduct their own backtests on different instruments, timeframes, and date ranges to understand how the strategy adapts to varying market structures. Past performance is not indicative of future results, and all trading involves significant risk.
🔧 THE DEVELOPMENT PHILOSOPHY: FROM VOLATILITY TO CLARITY
The journey to create VoVix+ began with a simple question: "What drives major market moves?" The answer is often not a change in price direction, but a fundamental shift in market volatility. Standard indicators are reactive to price. We wanted to create a system that was predictive of market state. VoVix+ was designed to go one level deeper—to analyze the behavior, character, and momentum of volatility itself.
The challenge was twofold. First, to create a robust mathematical model to quantify these abstract concepts. This led to the multi-layered analysis of ATR differentials and standard deviations. Second, to make this complex data intuitive and actionable. This drove the creation of the "Visual Universe," where abstract mathematical values are translated into geometric shapes, flows, and fields. The adaptive system was intentionally kept simple and transparent, focusing on a single, impactful parameter (time-based exits) to provide performance feedback without becoming an inscrutable "black box." The result is a tool that is both profoundly deep in its analysis and remarkably clear in its presentation.
⚠️ RISK DISCLAIMER AND BEST PRACTICES
VoVix+ is an advanced analytical tool, not a guarantee of future profits. All financial markets carry inherent risk. The backtesting results shown by the strategy are historical and do not guarantee future performance. This strategy incorporates realistic commission and slippage settings by default, but market conditions can vary. Always practice sound risk management, use position sizes appropriate for your account equity, and never risk more than you can afford to lose. It is recommended to use this strategy as part of a comprehensive trading plan. This was developed specifically for Futures
"The prevailing wisdom is that markets are always right. I take the opposite view. I assume that markets are always wrong. Even if my assumption is occasionally wrong, I use it as a working hypothesis."
— George Soros
— Dskyz, Trade with insight. Trade with anticipation.

MOM Buy/Sell + MACD Histogram Signal TableJarmo script ETGAG to be used for chart analysis
Meant to assist with determining how to choose direction

That Awesome StrategyThis is of course a work in progress. I really would like feedback.
I designed this specifically for the S&P 500, specifically ES1!, and have not tested on any other charts. I am not responsible for any losses you may incur by using this strategy.
This strategy is based in parts on MACD calculations, the momentum indicator i created, and a pair of dual offset identical moving averages, along with other tweaks.
It has a SL/TP function based on ticks.
It has several options for moving average types for the main moving averages, the MACD moving averages, and the momentum indicator moving average. Many combinations.
Since I am using a CME futures product for trading, this strategy automatically closes all trades at 2pm and disallows any trading until 4pm. I will update this with an adjustable time slot for this market closure time soon so that it will fit your timezone.
Pine Script version 6.

SMA Variancegives value between 9 and 20 SMA. looking to create alarm based on decreasing difference
after large gap.

Friedrich IndicatorThis indicator visualizes trend zones using two Exponential Moving Averages (EMAs) with user-defined lengths (default 32 and 58). It identifies bullish and bearish trends based on the relationship between the shorter and longer EMA and confirms these trends only after they persist for a specified number of bars (confirmBars).
Bullish zone (green): When the shorter EMA remains above the longer EMA for at least the confirmation number of bars, both EMAs and the area between them are colored green, indicating a confirmed upward trend.
Bearish zone (red): When the shorter EMA stays below the longer EMA for at least the confirmation bars, EMAs and the filled zone turn red, signaling a confirmed downward trend.
Neutral zone (white): Before the trend confirmation, the EMAs and the area between are colored white with transparency, representing an unconfirmed or neutral state.
The area between the two EMAs is filled with the respective color, providing an intuitive visual cue of market momentum and trend strength directly on the price chart.

Fempires (9 SMA + 21 EMA)Fempires (9 SMA + 21 EMA) Trading Indikator
This indicator is a simple yet effective trend-following tool based on the relationship between the 9-period Simple Moving Average (SMA) and the 21-period Exponential Moving Average (EMA). It visually highlights bullish and bearish conditions using dynamic color changes and a shaded zone between the two lines.
🔍 How It Works:
Green color indicates that the price is trading above the 21 EMA → Bullish bias
Red color shows that the price is trading below the 21 EMA → Bearish bias
The shaded area between the 9 SMA and 21 EMA helps you quickly identify momentum and potential trend reversals
📈 Ideal For:
Trend-following strategies
Entry/exit confirmation
Visual clarity in fast-moving markets
⚙️ Settings:
9-period SMA (fast trend)
21-period EMA (slow trend)
No complicated signals – just clear, visual guidance for intraday, swing, or scalping trades.

[GalihRidha] Scalping Dashboard 5m Scalping Dashboard 5m is a practical, real-time, and user-friendly indicator designed for 5-minute intraday scalping strategies. This indicator provides clear, actionable signals along with dynamic risk management levels, all visualized in a single vertical dashboard on your chart.
Key Features:
Actionable Next Signal:
Generates a strong, easy-to-follow trading signal ("LONG" or "SHORT") every 5 minutes, based on a multi-factor algorithm (MA20/MA50 trend, RSI, price/volume strength, candle momentum, and market structure).
Dynamic TP/SL Calculation:
Automatically displays recommended Take Profit (TP) and Stop Loss (SL) price ranges, calculated from recent price action, support/resistance, and volatility (ATR).
Vertical Dashboard Layout:
Information is neatly split between "LAST SECTION" (your most recent executed signal, TP, and SL) and "NEXT SECTION" (real-time signal, recommended TP/SL, and current price). Perfectly formatted for both desktop and mobile TradingView use.
Live "Capturing" Status:
When a new signal is forming (1 minute before candle close), the dashboard shows an animated "Capturing..." status—so you always know when the indicator is preparing the next actionable trade.
Buffered Signal Logic:
Prevents “signal repainting” by ensuring that your "Last Signal" and TP/SL levels are exactly what was shown in the previous Next Signal, never the recalculated value from a new bar. This is vital for honest backtesting and live trade confidence.
Zero Lag, Mobile Ready:
Designed to be lightweight and responsive, with instant dashboard updates and no visual lag—even on slower connections or when switching timeframes.
No repaint, no lagging, pure price action + volatility logic.
How to Use:
Add to Chart
Apply the indicator to any liquid crypto or forex pair on the 5-minute (5m) timeframe.
Watch the Dashboard
1 minute before the close of each 5-minute candle, the "Next Signal" section will activate.
"Capturing..." status (with animated dots) means a new entry signal is forming.
Use the suggested Entry, TP Range, and SL for your scalping strategy.
Follow the Signal
When "Next Signal" appears, you have 1 minute to enter the trade if desired.
After the signal passes, the values are locked into the "Last Section" for reference, record-keeping, or trade management.
Mobile Friendly
The vertical format ensures the dashboard is always visible and readable on both web and mobile versions of TradingView.
No need to manually refresh or guess when a new signal is forming—just watch for "Capturing..."!
Best Practice & Tips:
For best results, use on trending or high-volume assets. Avoid low liquidity or choppy sideways markets.
Combine with your own risk management and execution strategy for maximum performance.
This dashboard is 100% Pine Script v5, fully open-source, and does not repaint. You can customize TP/SL logic or integrate with alerts for even more automation.
Why This Indicator?
Most scalping indicators provide signals, but don't show you the real, actionable context—especially in mobile or fast-moving markets.
This dashboard solves that problem by giving you everything you need for quick, clear, and confident trading—all in one place, with true buffer logic so your entries and results are always honest and reproducible.
Happy scalping and stay disciplined—let the dashboard do the heavy lifting for you! 🚀

TRIPLE Moving AveragesThis Pine Script indicator plots three customizable moving averages (MAs) along with an optional composite MA (average of all three). It provides visual cues, alerts, and trend confirmation based on MA crossovers and price positioning relative to the MAs.
🔹 Key Features
1. Multiple Moving Average Types
Supports 7 different MA types for each line:
EMA (Exponential Moving Average)
SMA (Simple Moving Average)
SMMA / RMA (Smoothed / Regular Moving Average)
WMA (Weighted Moving Average)
VWMA (Volume Weighted Moving Average)
HMA (Hull Moving Average)
2. Three Independent MAs
MA1, MA2, MA3 can each be enabled/disabled
Custom lengths (default: 12, 21, 50)
Different price sources (close, open, high, low, etc.)
3. Composite Moving Average (Optional)
Calculates (MA1 + MA2 + MA3) / 3
Acts as a consensus trend filter
4. Visual & Alert Features
✅ Color-Coded Lines (Yellow = Price Above MA, Red = Price Below MA)
✅ Thick Line Width (3) for better visibility
✅ Background Highlights for crossovers/crossunders
✅ Alerts for All Crossover Combinations
🔹 How It Works
📈 MA Crossovers & Trend Signals
Bullish Signal: When a faster MA crosses above a slower MA
Bearish Signal: When a faster MA crosses below a slower MA
Trend Confirmation: All MAs aligned in the same direction (e.g., MA1 > MA2 > MA3 = Strong Uptrend)
🎨 Visual Indicators
Green Background → Bullish crossover detected
Red Background → Bearish crossover detected
Yellow Line → Price is above the MA (bullish)
Red Line → Price is below the MA (bearish)
🔔 Alert Conditions
Alerts are triggered for all possible MA crossover combinations, including:
MA1 crossing MA2
MA1 crossing MA3
MA2 crossing MA3
Any MA crossing the Composite MA

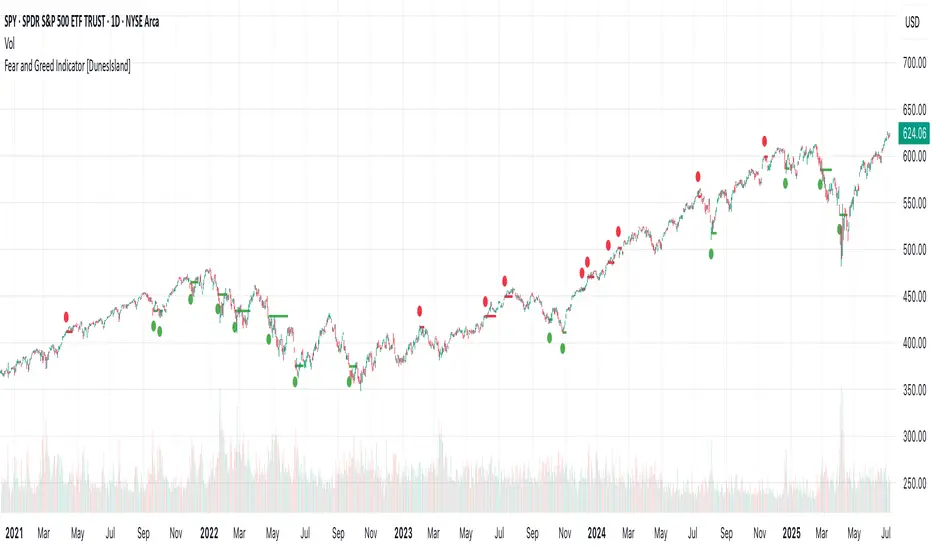
Fear and Greed Indicator [DunesIsland]The Fear and Greed Indicator is a TradingView indicator that measures market sentiment using five metrics. It displays:
Tiny green circles below candles when the market is in "Extreme Fear" (index ≤ 25), signalling potential buys.
Tiny red circles above candles when the market is in "Greed" (index > 75), indicating potential sells.
Purpose: Helps traders spot market extremes for contrarian trading opportunities.Components (each weighted 20%):
Market Momentum: S&P 500 (SPX) vs. its 125-day SMA, normalized over 252 days.
Stock Price Strength: Net NYSE 52-week highs (INDEX:HIGN) minus lows (INDEX:LOWN), normalized.
Put/Call Ratio: 5-day SMA of Put/Call Ratio (USI:PC).
Market Volatility: VIX (VIX), inverted and normalized.
Stochastic RSI: 14-period RSI on SPX with 3-period Stochastic SMA.
Alerts:
Buy: Index ≤ 25 ("Extreme Fear - Potential Buy").
Sell: Index > 75 ("Greed - Potential Sell").
EMA-Pack MTFEMA-Pack MTF
This TradingView Pine Script defines a custom indicator called "EMA-Pack MTF" that overlays various types of moving averages and Bollinger Bands across multiple timeframes on a chart. It begins by importing the built-in technical analysis library and defining a custom ma function that calculates several types of moving averages (SMA, EMA, TEMA, DEMA, HMA, and ALMA) based on user input. The ema function is the core logic, retrieving market data for the specified timeframe and calculating fast, mid, slow, 50, 100, and 200-period moving averages along with Bollinger Band components (basis, upper, and lower bands). The function adjusts values to the nearest valid price tick and returns them.
User input fields allow customization of timeframes, source data, moving average types, and Bollinger Band parameters. The script calls the ema function for each selected timeframe (1 minute, 5 minutes, 15 minutes, 1 hour, 4 hours, and 1 day), storing their respective computed values. It then plots the calculated moving averages and Bollinger Band basis lines on the chart, using different colors and line widths to distinguish between them. Some plots are hidden by default (display.none) to reduce chart clutter. This script is useful for multi-timeframe trend analysis using customizable moving averages and Bollinger Bands.

Super Neema!🟧 Super Neema! — Multi-Timeframe EMA-9 Overlay
🔍 What is "Neema"?
The term "Neema" has recently emerged among traders such as Jeff Holden—a top proprietary trading firm trader—whose colleagues colloquially use "Neema" as shorthand for the 9-period Exponential Moving Average (EMA). Due to its increasing popularity and reliability, the phrase caught on quickly as traders needed a quick, memorable name for such an essential tool.
📚 Why the 9-EMA?
Scalping around the 9-EMA is now one of the most widely used intraday trading techniques. Traders of various experience levels frequently rely on it because it effectively highlights short-term momentum shifts.
But there's a crucial nuance: traders across different assets or market periods don't always agree on which timeframe’s 9-EMA to follow. Depending on who's currently active in the market, the dominant "Neema" could be the 1-minute, 2-minute, 3-minute, or 5-minute 9-EMA. This variation arises naturally due to differences in trader populations, risk tolerance, style, and current market conditions.
👥 Social Convention & Normative Social Influence
Trading is fundamentally a social activity, and normative social influence plays a critical role in market behavior. Traders don’t operate in isolation; they follow patterns, respond to cues, and rely on shared conventions. The popularity of any given indicator—like the 9-EMA—is not just technical, but deeply social. Traders adapt to what's socially accepted, recognizable, and effective.
Over time, these conventions shift. What once was "the standard" timeframe can subtly evolve as dominant traders or institutions shift their preferred style or timeframe, creating "variants" of established trends. Understanding this dynamic is essential for market participants because recognizing where the majority of traders currently focus gives a critical edge.
📈 Why Does This Matter? (Market Evolution & Trader Adaptability)
Market trends aren't just technical—they're social constructs. As markets evolve, participants adapt their methods to fit new norms. Traders who recognize and adapt quickly to these evolving norms gain a decisive advantage.
By clearly visualizing multiple Neemas (9-EMAs across timeframes) simultaneously, you don't merely see EMA levels—you visually sense the current social convention of the market. This heightened awareness helps you stay adaptive and flexible, aligning your strategy dynamically with the broader community of traders.
🎨 Transparency Scheme (Visual Identification):
5-minute Neema: Most opaque, brightest line (slowest, most significant trend)
3-minute Neema: Slightly more transparent
2-minute Neema: Even more transparent
1-minute Neema: Most transparent, subtle background hint (fastest, quickest reaction)
This deliberate visual hierarchy makes it intuitive to identify immediately which timeframe is currently dominant, and therefore, which timeframe other traders are using most actively.
✅ Works on:
Any timeframe, any chart. Automatically plots the 1m–5m EMA-9 lines regardless of your current chart.
🧠 Key Insight:
Markets are driven by social trends and normative influence.
Identifying the currently dominant timeframe (the Neema most respected by traders at that moment) is a powerful, socially-informed edge.
Trader adaptability isn't just technical—it's social awareness in action.
Enjoy your trading, and welcome to Super Neema! ⚡

ma rationing🧠 MA Rationing Indicator – Multi-Averaged Momentum + Divergence Zones
This script blends various moving average ratios (SMA, EMA, WMA, RMA) to create a smoothed and zero-centered momentum oscillator. Its goal is to highlight shifts in trend strength and spot possible divergences confirmed by volume.
🔍 Key Features:
• MA Ratio Core: Composite of multiple MA types across a short vs. long smoothing window, plotted against zero for trend clarity.
• Visual Acceleration Markers: Circle color intensity reflects momentum acceleration or deceleration.
• Volume-Supported Divergence: Highlights when price diverges from momentum and volume supports the signal.
• RSI Zone Highlighting: Dynamically draws boxes over RSI Overbought/Oversold regions as sentiment zones form.
• Custom Alerts: Includes alerts for zero-line crosses and divergence + volume confirmation.
This tool is designed for users seeking to combine price action, momentum, and volume into one clear visualization. It does not provide direct trade signals and should be used alongside your broader analysis.

SMA Crossover Strategy with TP/SL📊 Strategy Description: SMA Crossover Strategy with TP/SL
This is a Simple Moving Average (SMA) Crossover Strategy designed to help traders identify trend reversals and manage trades with proper risk-reward logic.
🔹 Entry Logic:
Buy Signal: When the Fast SMA crosses above the Slow SMA → indicating a bullish trend.
Sell Signal: When the Fast SMA crosses below the Slow SMA → indicating a bearish trend.
🔹 Exit Logic:
Take Profit: The strategy exits the position when price reaches a user-defined profit target.
Stop Loss: The trade is closed if price moves against the position beyond the specified stop-loss limit.
⚙️ Parameters:
Fast SMA Length: Number of candles used for fast moving average (default: 10)
Slow SMA Length: Number of candles used for slow moving average (default: 30)
Take Profit (%): Profit target in percentage (default: 0.10%)
Stop Loss (%): Maximum allowed loss per trade (default: 0.10%)
✅ Additional Features:
Strategy backtesting supported
Visual arrows for Buy/Sell signals
Bar coloring based on trend
Alert conditions for Buy/Sell crossover signals
🧠 Suggested Use:
Works best on 1 min, 5 hour, or daily timeframes.
Can be applied to stocks, crypto, forex, or indices.
Ideal for trend-following traders who want automation with risk control.

MA Crossover Strategy with TP/SL (5 EMA Filter)How the Strategy Works on a 5-Minute Chart:
Data Input (5-Minute Candles):
Every single data point (candle) on your chart will represent 5 minutes of price action (Open, High, Low, Close for that 5-minute period).
All calculations (MAs, EMA, signals) will be based on these 5-minute price data points.
Moving Average Calculations:
Fast MA (10-period SMA): This will be the Simple Moving Average of the closing prices of the last 10 five-minute candles. It reacts relatively quickly to recent price changes.
Slow MA (30-period SMA): This will be the Simple Moving Average of the closing prices of the last 30 five-minute candles. It represents a slightly longer-term trend compared to the Fast MA.
5 EMA (5-period EMA): This is the Exponential Moving Average of the closing prices of the last 5 five-minute candles. Being an EMA, it gives more weight to the most recent 5-minute prices, making it very responsive to immediate price action.
Signal Generation (Entry Conditions):
Long Entry Signal:
The 10-period SMA crosses above the 30-period SMA (indicating a potential bullish shift in the short-to-medium term trend).
AND the current 5-minute candle's closing price is above the 5-period EMA (confirming that the immediate price momentum is also bullish and supporting the crossover).
If both conditions are met at the close of a 5-minute candle, a "Buy" signal is generated.
Short Entry Signal:
The 10-period SMA crosses below the 30-period SMA (indicating a potential bearish shift).
AND the current 5-minute candle's closing price is below the 5-period EMA (confirming immediate bearish momentum).
If both conditions are met at the close of a 5-minute candle, a "Sell" signal is generated.
Trade Execution:
When a signal is triggered, the strategy enters a trade (long or short) at the closing price of that 5-minute candle.
Immediately upon entry, it places two contingent orders:
Take Profit (Target): Set at 2% (by default) away from your entry price. For a long trade, it's 2% above; for a short trade, 2% below.
Stop Loss: Set at 1% (by default) away from your entry price. For a long trade, it's 1% below; for a short trade, 1% above.
The trade will remain open until either the Take Profit or Stop Loss price is hit by subsequent 5-minute candles.
Implications for Trading on a 5-Minute Chart:
Increased Trade Frequency: You will likely see many more signals and trades compared to higher timeframes (like 1-hour or daily charts). This means more potential opportunities but also more transaction costs (commissions, slippage).
Sensitivity to Noise: Lower timeframes are more prone to "market noise" – small, random price fluctuations that don't indicate a true trend. While the 5 EMA filter helps, some false signals might still occur.
Faster Price Action: Price movements can be very rapid on a 5-minute chart. Your take profit or stop loss levels might be hit very quickly, sometimes within the same or next few candles.
Parameter Optimization is Crucial: The default MA lengths (10, 30) and EMA (5) might not be optimal for every asset or market condition on a 5-minute chart. You'll need to backtest extensively and potentially adjust these lengths, as well as the targetPerc and stopPerc, to find what works best for the specific instrument you're trading.
Risk Management: The fixed percentage stop loss is vital on a 5-minute chart due to its volatility. Without it, a few unfavorable moves could lead to significant losses.

DT AlertsA pretty stink indicator for trading. Only use this is you don't mind losing every now and then.

WRAMA Channel (Weighted RSI ATR MA)OVERVIEW
The WRAMA Channel (Weighted RSI ATR MA) is an advanced technical analysis tool designed to react more quickly to price movements compared to indicators using conventional moving averages. It combines the Relative Strength Index (RSI), Average True Range (ATR), and a weighted moving average, resulting in the WRAMA. This indicator forms a dynamic price channel based on a weighted average that incorporates both trend strength (via RSI) and market volatility (via ATR). It helps traders identify trends, potential reversals, and breakout signals, while offering broad customization options.
Key Features
WRAMA Price Channel:
Generates a dynamic channel around the weighted moving average (WRAMA), adapting to market volatility and momentum, similar to Bollinger Bands. Users are encouraged to adjust channel width and length according to their strategy.
The upper and lower channel bands are calculated based on a percentage deviation from the baseline line.
The channel fill color changes depending on the price's position relative to the baseline (green above, red below), with an optional gradient for better visualization.
Weighted Moving Average (WRAMA):
WRAMA is a custom weighted moving average (MA1), where closing prices are weighted based on RSI and ATR, allowing it to dynamically adapt to market conditions.
Baseline: The WRAMA line calculated over a user-defined period.
WRAMA Calculation:
RSI Weight: Based on RSI value. When RSI is in extreme zones (below the lower threshold or above the upper threshold), an extreme weight is applied. Otherwise, the weight is based on the squared RSI value divided by 100, raised to a power defined by the rsi_weight_factor.
ATR Weight: Based on the ATR-to-average-ATR ratio. If ATR exceeds a threshold (atr_threshold × avg_atr), an extreme weight is applied. Otherwise, the weight is based on the squared ratio of ATR to average ATR, raised to the power of the atr_weight_factor.
Combined Weight: RSI and ATR weights are combined using a rsi_atr_balance parameter. Final weight = RSI weight × balance + ATR weight × (1 - balance).
WRAMA Calculation: The closing price is multiplied by the combined weight. The result is averaged over the ma_length period and divided by the average of the weights, forming the WRAMA line. For current WRAMA (ma_length = 1), the calculation simplifies to a single weighted price.
Additional Moving Averages:
For additional confirmations, the indicator supports up to five moving averages (MA1–MA5) with various types (SMA, EMA, WMA, HMA, ALMA) and customizable periods.
All additional MAs are calculated based on WRAMA or its baseline, ensuring consistency and enabling deeper analysis within a unified methodology. MA trend directions can be tracked in a built-in signal table.
Trading Signals:
Breakout Signals: Breakouts above/below the channel are optionally marked with triangle shapes (green for bullish, red for bearish).
MA Signals: Price position relative to MAs or their slope generates bullish/bearish signals. These are optionally visualized with default triangles (green up, red down).
A signal table in the top-right corner summarizes the status of each moving average – bullish, bearish, or neutral.
Customization Options
Channel Settings:
MA Period: Length of the WRAMA baseline (default: 100).
Channel Deviation : Percentage offset from the baseline for upper/lower bands (default: 1.5%).
RSI Settings:
RSI Period: Length of the RSI calculation (default: 14).
RSI Upper/Lower Threshold: Overbought/oversold levels (default: 70/30).
RSI Weight Factor: Influence of RSI on weighting (default: 2.0).
ATR Settings:
ATR Period: ATR calculation length (default: 14).
ATR Threshold: Volatility threshold as a multiple of average ATR (default: 1.5).
ATR Weight Factor: Influence of ATR on weighting (default: 2.0).
RSI & ATR Combined:
Extreme Weight: Weight applied in extreme RSI/ATR conditions (default: 3.0).
RSI/ATR Balance: Balance between RSI and ATR influence (default: 0.5).
Signal Settings:
Show Breakout Signals: Enable/disable breakout triangles.
Show MA Signals: Enable/disable MA-based signals.
MA Signal Source: Choose between current WRAMA or baseline.
MA Signal Analysis: Based on price position or slope.
Neutral Threshold : Minimum distance from MA for signal neutrality (default: 0.5%).
Minimum MA Slope : Minimum slope for trend direction signals (default: 0.01%).
Moving Averages (MA1–MA5):
Options to enable/disable, select type (SMA, EMA, WMA, HMA, ALMA), set period length, and choose color.
Style Settings:
Gradient Fill: Enable/disable gradient coloring within the channel.
Show Baseline: Enable/disable WRAMA baseline visibility.
Colors: Customize line, fill, and signal colors.
Use Cases
Trend Identification: The WRAMA channel highlights trend direction and potential reversal zones when price contacts the channel edges.
Breakout Signals: Channel breakouts may indicate trend shifts or momentum surges.
MA Analysis: The signal table provides a clear summary of market direction (bullish, bearish, or neutral) based on selected moving averages.
Trading Strategies: Suitable for trend-following, mean-reversion, and scalping strategies, depending on user preferences and settings.
Notes
The indicator offers a high degree of flexibility, making it adaptable to various trading styles, instruments, and timeframes.
It is recommended to adjust channel length and width to fit your trading strategy.
Backtesting settings on historical data is advised to optimize parameters for a specific strategy and market.

Volumetric Compressed MAVCMA uses the compressor and weighted stdev functions originally translated to pine by @gorx1. Compressor is usually used in audio to avoid clipping of certain frequencies. The original idea is actually pretty simple:
ma(simple string smt, float src, simple int len) =>
switch smt
'RMA' => ta.rma(src, len)
'SMA' => ta.sma(src, len)
'EMA' => ta.ema(src, len)
'WMA' => ta.wma(src, len)
'HMA' => ta.hma(src, len)
'LSMA' => ta.linreg(src, len, 0)
=> na
compressor(float in_1, simple int len, simple int thresh_dn_m, simple int thresh_up_m) =>
data = math.log(math.abs(in_1))
loc = ta.wma(data, len)
dev = wstdev(data, len)
thresh_dn = loc + dev * thresh_dn_m
thresh_up = loc + dev * thresh_up_m
math.exp(math.min(math.max(data, thresh_up), thresh_dn)) - math.exp(thresh_up)
compressed_out = compressor(volume, len_window, up_thresh, down_thresh)
comp_ma = ma(ma_type, close * compressed_out, len_ml) / ma(ma_type, compressed_out, len_ml)
vwma = ma(ma_type, close, len_window)
We get the ratio of the compressed volume calculation and plot it with the base MA. Base MA's length is determined by window size input compared to ML length that is used for compressed version.
This provides us another possible confirmation indicator that can be used to take advantage of volume ranges. Autmated crossover alerts are also added. A reminder is that this kind of indicators should not be used on it's own for trading but rather should be used as a confirmation along with your trend detection and main entry indicators to provide additional confluence.

Multi SMA AnalyzerMulti SMA Analyzer with Custom SMA Table & Advanced Session Logic
A feature-rich SMA analysis suite for traders, offering up to 7 configurable SMAs, in-depth trend detection, real-time table, and true session-aware calculations.
Ideal for those who want to combine intraday, swing, and higher-timeframe trend analysis with maximum chart flexibility.
Key Features
📊 Multi-SMA Overlay
- 7 SMAs (default: 5, 20, 50, 100, 200, 21, 34)—individually configurable (period, source, color, line style)
- Show/hide each SMA, custom line style (solid, stepline, circles), and color logic
- Dynamic color: full opacity above SMA, reduced when below
⏰ Session-Aware SMAs
- Each SMA can be calculated using only user-defined session hours/days/timezone
- “Ignore extended hours” option for accurate intraday trend
📋 Smart Data Table
- Live SMA values, % distance from price, and directional arrows (↑/↓/→)
- Bull/Bear/Sideways trend classification
- Custom table position, size, colors, transparency
- Table can run on chart or custom (higher) timeframe for multi-TF analysis
🎯 Golden/Death Cross Detection
- Flexible crossover engine: select any two from (5, 10, 20, 50, 100, 200) for fast/slow SMA cross signals
- Plots icons (★ Golden, 💀 Death), optional crossover labels with custom size/colors
🏷️ SMA Labels
- Optional on-chart SMA period labels
- Custom placement (above/below/on line), size, color, offset
🚨 Signal & Trend Engine
- Bull/Bear/Sideways logic: price vs. multiple SMAs (not just one pair)
- Volume spike detection (2x 20-period SMA)
- Bullish engulfing candlestick detection
- All signals can use chart or custom table timeframe
🎨 Visual Customization
- Dynamic background color (Bull: green, Bear: red, Neutral: gray)
- Every visual aspect is customizable: label/table colors, transparency, size, position
🔔 Built-in Alerts
- Crossovers (SMA20/50, Golden/Death)
- Bull trend, volume spikes, engulfing pattern—all alert-ready
How It Works
- Session Filtering:
- SMAs can be set to count only bars from your chosen market session, for true intraday/trading-hour signals
Dynamic Table & Signals:
- Table and all signal logic run on your selected chart or custom timeframe
Flexible Crossover:
- Choose any pair (5, 10, 20, 50, 100, 200) for cross detection—SMA 10 is available for crossover even if not shown as an SMA line
Everything is modular:
- Toggle features, set visuals, and alerts to your workflow
🚨 How to Use Alerts
- All key signals (crossovers, trend shifts, volume spikes, engulfing patterns) are available as alert conditions.
To enable:
- Click the “Alerts” (clock) icon at the top of TradingView.
- Select your desired signal (e.g., “Golden Cross”) from the condition dropdown.
- Set your alert preferences and create the alert.
- Now, you’ll get notified automatically whenever a signal occurs!
Perfect For
- Multi-timeframe and swing traders seeking higher timeframe SMA confirmation
- Intraday traders who want to ignore pre/post-market data
- Anyone wanting a modern, powerful, fully customizable multi-SMA overlay
// P.S: Experiment with Golden Cross where Fast SMA is 5 and Slow SMA is 20.
// Set custom timeframe for 4 hr while monitoring your chart on 15 min time frame.
// Enable Background Color and Use Table Timeframe for Background.
// Uncheck Pine labels in Style tab.
Clean, open-source, and loaded with pro features—enjoy!
Like, share, and let me know if you'd like any new features added.

MA Respect IndicatorThis indicator tells you how much a moving average is being respected.
Green = highly respected
Blue = watch out, transitioning
Red = not respected at all.
If you trade moving averages, you may find this very helpful with determining when and when not to trust a MA. This can be changed to look at a VWAP, and many other different MA calculation types.

SMA Ratio w/ RSI, BB & EMAOverview:
This strategy combines signal-based trend logic with advanced volatility filters, RSI confirmation, dynamic stop-loss/take-profit levels, and higher-timeframe (HTF) trend validation. A fully visual dashboard provides live feedback on market conditions, win rates, and current signal strength.
Key Features:
🔁 Dynamic Stop-Loss/Take-Profit based on ATR and signal strength
📶 Gradient Signal Strength using custom SMA/EMA crossovers
📊 Higher Timeframe Trend Filter for directional bias
🌀 Bollinger Band Squeeze Filter to detect low-volatility breakout zones
💹 RSI Filter to avoid overbought/oversold traps
🧠 Signal Classification: Detects LH/HL Buy/Sell setups and displays them as labels (e.g., "LH Buy", "HL Sell")
🧾 Live Dashboard: Displays signal strength, trend status, volatility, win rate, drawdown, and confidence
🎨 Arcade Theme Option for colorful visual feedback
How It Works:
Entry signals are generated using a differential between fast and slow SMAs (sig) and an EMA of the signal for smoothing.
ATR and Bollinger Band widths adjust SL/TP zones based on market volatility.
Higher timeframe EMA determines bullish or bearish market bias.
Confirmations require RSI agreement and a Bollinger Band squeeze breakout.
Trade Classification Logic:
LH Buy/Sell = Lower High → potential weak reversal
HL Buy/Sell = Higher Low → potential strength after correction
These are shown with labels on the chart to help you assess trade strength visually.
Best Use:
Works on various timeframes
Suitable for trend-following strategies with volatility-based exits
Ideal for traders who want clarity and visual feedback on trade quality
⚠️ Disclaimer: This is a strategy script for educational purposes only. Always test thoroughly on demo accounts before using with real capital.

Forex Dynamic Momentum Reversal (FDMR) - AlternativeRed and green dashed lines on the last bar represent the upper and lower volatility bands, extending from the previous bar.
Blue and orange labels on the last bar show the fast and slow EMA values.
Green triangles below bars indicate buy signals; red triangles above bars indicate sell signals.
Enable Alerts: Set up alerts in TradingView for buy/sell signals.
